Abstract
Introduction:
The usage of cytogenetics and next generation sequencing (NGS) has become more prominent in recent years for risk stratification of patients (pts) with myelodysplastic syndromes (MDS). Management of these patients is a multi-faceted endeavor which requires understanding of how MDS genetics interacts with a patient's lifestyle and co-morbidities. Obesity rates in the United States continue to rise; the current rate in Virginia is 30% (Centers for Disease Control and Prevention, CDC). This study analyzed whether body mass index (BMI) at diagnosis was correlated with the number or type of MDS mutations seen on initial NGS and whether obesity influenced outcomes stratified by individual mutations.
Methods:
Adult pts diagnosed with MDS at the University of Virginia from August 2012 to December 2019 who had cytogenetics and NGS panels done prior to initiation of MDS therapy were included. Any patient without the aforementioned initial diagnostic information was excluded. MDS disease characteristics, treatment type, comorbidities, and patient demographics were assessed including weight, height, and BMI (categories defined per CDC) at time of diagnosis. The primary aim of this analysis was to evaluate the association of BMI with the number and type of mutations on NGS panel at diagnosis. Wilcoxon-Mann-Whitney tests were used to explore the difference in BMI by presence of 13 mutations of interest: ASXL1, DNMT3A, FLT3, IDH1, IDH2, NPM1, NRAS, SETBP1, SF3B1, SRSF2, TET2, TP53, and U2AF1. The Spearman correlation coefficient was used to assess the relationship between BMI and total number of mutations. Kaplan-Meier estimates, log rank tests, and Cox proportional hazard models were used for time-to-event analyses. All analyses were performed using SAS 9.2 (SAS Institute, Cary, NC).
Results:
143 MDS pts met inclusion criteria with a median age at diagnosis of 69 (range 39-87) and 60.7% (n=88) were male. The median weight was 81.3 kg and the median BMI at diagnosis was 27.7 kg (range 16.04-52.66). There were 29 pts in the normal BMI class (20%), 4 pts in the underweight class (3%), 38 pts in the obese class (26%), and 72 pts in the overweight class (50%). By IPPS-R risk scoring system, 64 pts were low or very low risk (44%), 39 pts intermediate risk (27%), and 41 pts high or very high risk (29%).
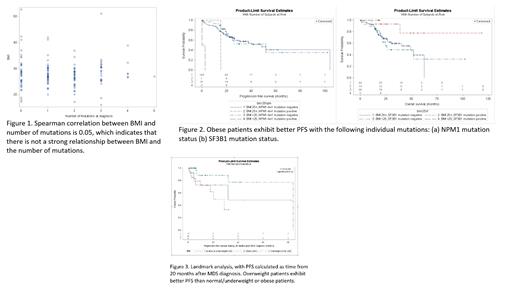
There was no difference in the median number of mutations across BMI groups with a spearman correlation coefficient of 0.05 (Figure 1). However, the median BMI was significantly lower in patients with the NPM1 mutation versus those without (p=0.04), diagnosed prior to the WHO re-classification of these patients to acute myeloid leukemia (AML). Presence of the NPM1 mutation in MDS is also associated with worse PFS and an increased hazard ratio of 9.4 (p=0.0003), likely behaving similarly to AML. In comparison, presence of the SF3B1 mutation was found to be protective wherein patients who lacked the mutation had an increased hazard ratio of 6.0 (p=0.0133). BMI alone did not predict for progression free survival (PFS) or overall survival (OS); this was also true regardless of patient residency based on zip code. However, obese patients exhibiting the NPM1 and SF3B1 had better PFS (Figure 2). Moreover, the landmark analysis indicates among patients who are alive and free of progression at 20 months after MDS diagnosis, overweight patients exhibit better PFS than normal/underweight or obese patients (p=0.0192) (Figure 3).
Conclusion:
While BMI in pts with MDS does not appear to predict the gross number of NGS mutations, NPM1 mutations occurred more often in pts with low BMIs. Overweight pts who did not progress by 20 months have a better PFS. Prospective and larger retrospective studies are needed to expand on the findings that BMI may have an unexplored potential in stratifying pts with newly diagnosed MDS.
No relevant conflicts of interest to declare.


